GreenEye’s first test of water supply-demand for crops
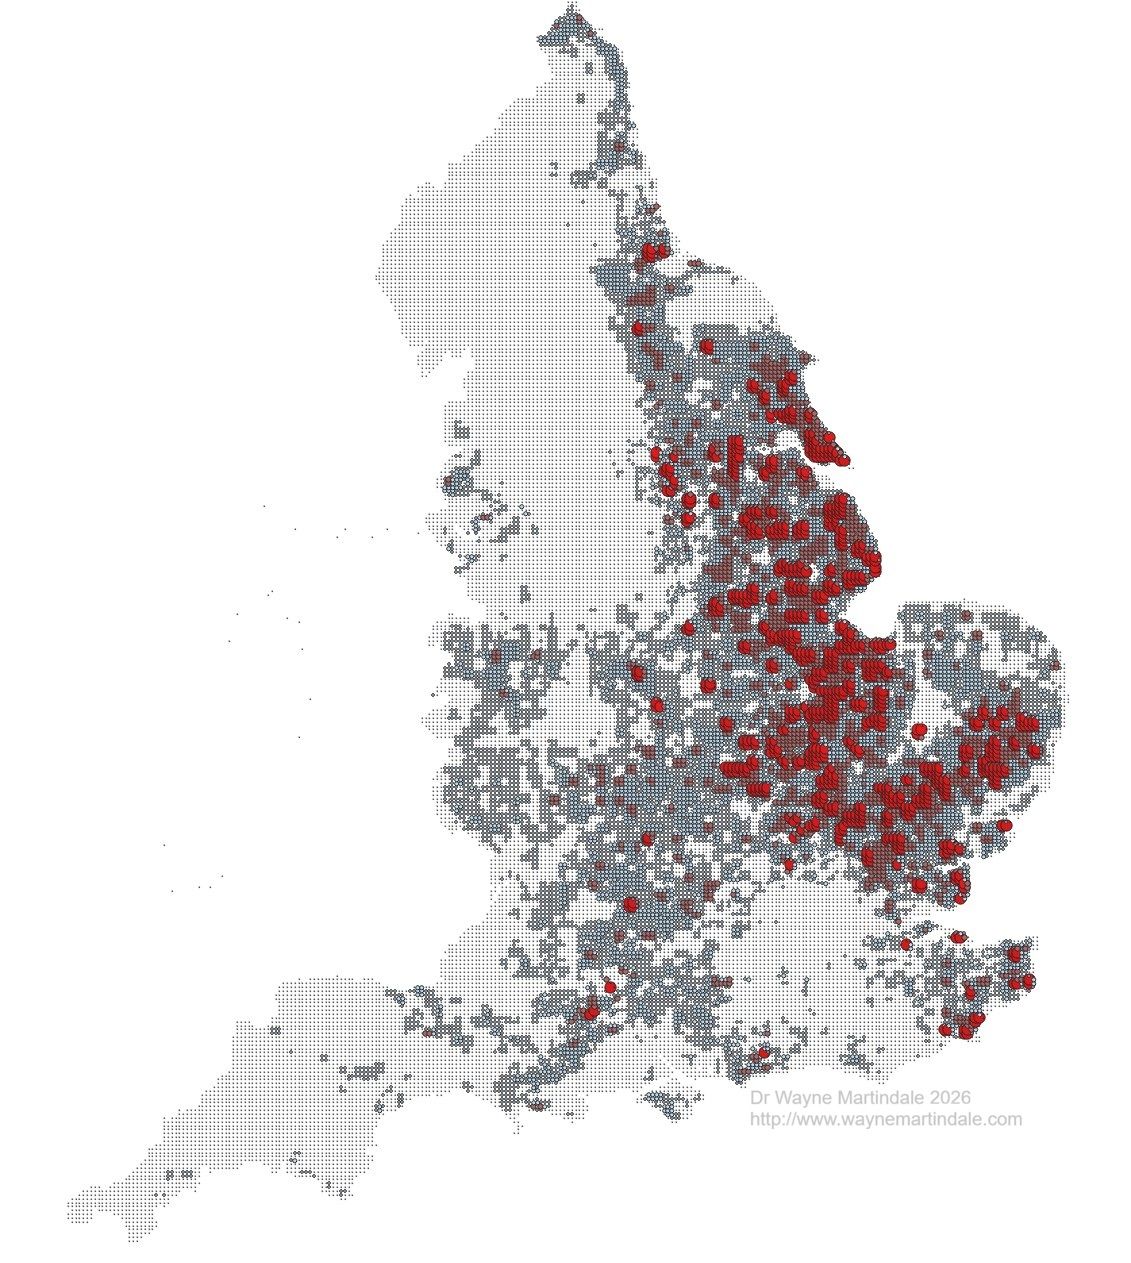
There is a lot of reporting being made for crop water balance at present- it is in deficit for adequate production and crop security- and like all food security warnings in developed nations they happen when there is surplus, in this case- the current flood warnings and a look out of the window provides a vista of constant rain. However, the deficit is real and some noteworthy work we delivered for digital agronomy apps in the last year worked out the water requirements of crops for evapotranspiration- this graphic shows a screenshot of UK wheat crop water requirements- the red shading is where over 100 thousand tonnes of water are transpired by the wheat crop per sq km for the last annual sow-to-harvest cycle, balancing this with water available from surface water and aquifers is getting to be a much tighter margin year-on-year, time to make haste.
Future climate, changes in agronomy and cropping limit
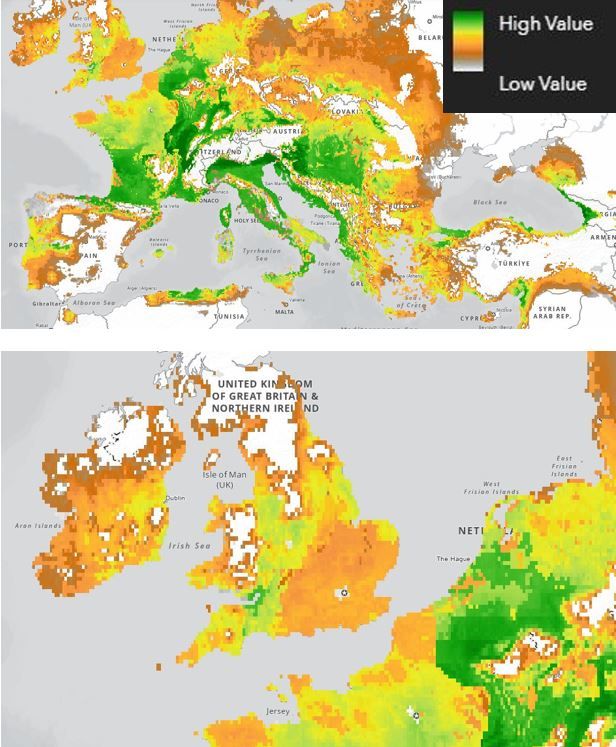
“Think oranges don’t grow in the UK? Give it 60 years.” Back when I was teaching agriculture and sustainability in the 2000s, I used to joke that Yorkshire wasn’t exactly the place for pineapples, mangoes, or oranges whenever someone asked why we couldn’t just eat local produce. But things change. I’ve been working with GAEZ4 data and if we continue on our current path, in around 60 years we could be growing oranges in a corridor from Newcastle to Bristol — yielding 3 to 9 tonnes per hectare. I know there are few caveats but climate change is now about how we adapt.
Carbon farming- a plant biochemistry and physiology starter
We need to understand carbon balances for agri- production, land management and so that practical working limits for what we term carbon sequestration can be met, developing a robust methodology for this has led to understanding assessment of carbon sink relationships with water use, biodiversity and other ecosystem services. A limit for dynamic fixation of carbon by crops must be photosynthetic carbon fixation, this carbon can be lost or utilised by metabolism, respiration and structural development which in the case of something like grass, where 70% of biomass is not used because it is water that is driven off by being wilted in the sun or dried in barns after cutting. That brings us to water, the amount of water required for biomass production is metabolically limited and therefore we use this to calculate how much water is needed to be transpired for a given yield. Knowing these amounts means we can calculate water stress when we build-in rainfall and groundwater use. All of these are growing in importance with our UK dry summers and wet springs- planning ahead in such uncertian patterns is an essential part of reducing commercial risk. Using the balancing calculations we have developed in models for grass over 5yrs (75% of grassland in England), potatoes and wheat.
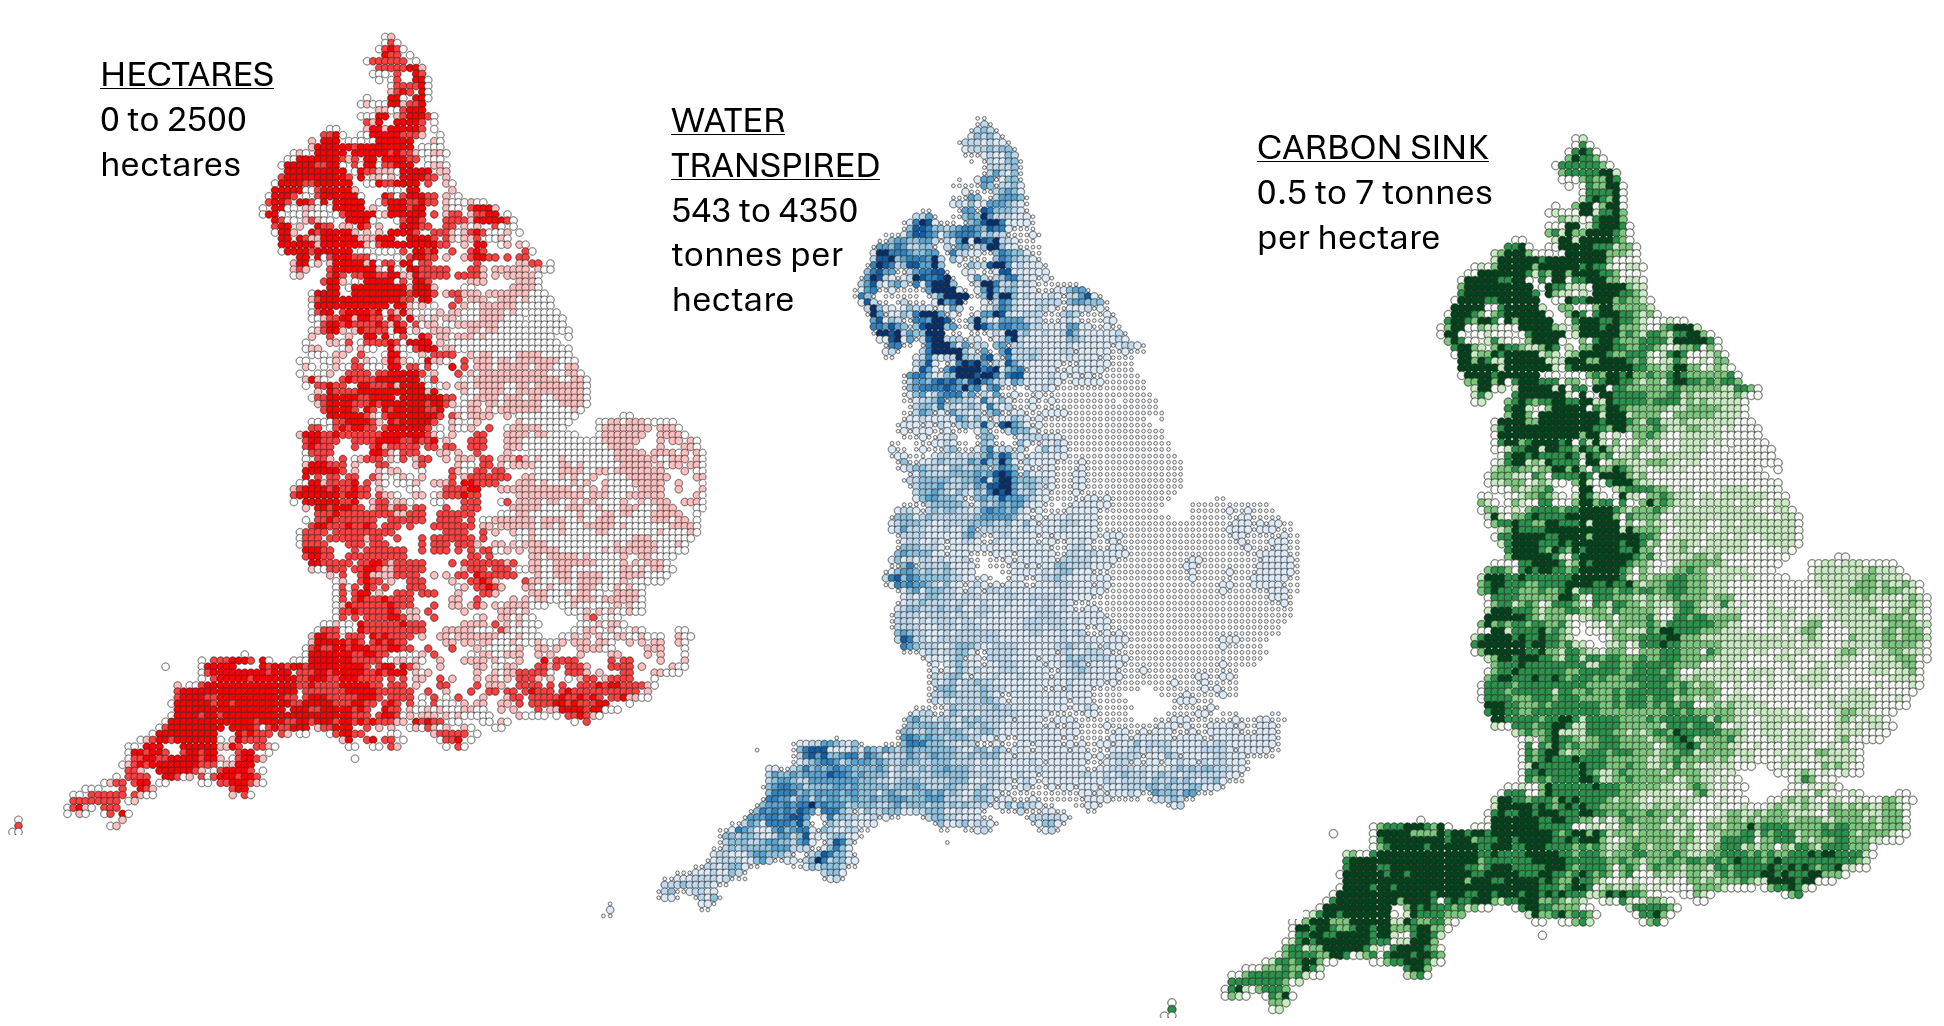
The first calculations are presented spatially here for grass over 5yrs, the maps will be used with further granular data to provide carbon and water eco-system service values for specific agri-enterprises and individual farms. Choosing grass cropping is important because it is a connector to grazing and biodiversity services that have always caught our interest, grassland enterprises are also the more complex of cropping systems with regard to weather in that a whole production strategy can change in an instant because of 10 mm of rainfall. You need to be risk-readied, and data makes that possible if you are asking the right questions and looking at it in the right way- with a map!
The figure shows our initial tests for grass over 5 years in England for a year of evapo-transpired water and carbon sink, assuming 30% DM, a 20 tonne/ha biomass yield, carbon fixation/respiration constants, a leaf Area index of 3 across the growing season. We are starting to build the tool base and are testing for wheat, potatoes and top-fruit- first look, it is throwing some big surprises
The first thing to mention is the scale of water use and residual carbon, is that it screams at us, ‘where does that water come from, is it sufficient and where does that residual carbon go, can it be used’. Also, ‘what happens if residual carbon decreases and is that inescapable for some cropping?’ The whole issue of what a crop requires, removes and leaves behind is pretty straightforward to understand here, presenting that data spatially really does focus agri-environment strategy without the muck and mystery carbon accounting will often push onto us. This approach to the numbers with no greenwashing.
We are developing real-time data platforms for practical farm and landscape management of eco-system services. The concepts are borne from our interest in the first ecosystem paper we saw way back in 1997 from Costanza et al, in that Nature paper we saw how things could be calculated and considered within an economic framwork. Even further back are the agronomic constants on which we stand on the shoulders of others- some of them bigger and more useful than others!